Link Error Workaround Procedure for VTrak E-Class
Version 1.0 - January 18th, 2008
For proper Telnet or HyperTerminal console connections, see:
The VTrak J-Class Product Manual:
http://www.promise.com/upload/Support/Manual/VTrak_J610s_J310s_PM_v1.0a.pdf
The VTrak E-Class Product Manual:
http://www.promise.com/upload/Support/Manual/VTrak_E-Class_PM_v2.pdf
Step 1: Preparing Your System
- Verify that the RAID Head is in Active/Active mode.
At the command line, type ctrl –v and press Enter.
- Verify that your logical drives show normal status.
At the command line, type logdrv –v and press Enter.
If your RAID Head is in Active/Active mode and all logical drives are normal, you are ready to export the Subsystem log either via the CLI or WebPAM PRO.
Step 2: Checking the RAID Head for Link Errors
WARNING: While in single controller mode (maintenance mode), do not attempt to save the configuration via WebPAM PRO or CLI/CLU. Doing so while running firmware build 3.22.0000.00 or older will cause the remaining controller to reset—thus causing the remaining RAID Head IO Module to reboot. This action will cause all IOs on the host to fail and will cause down time.
This is applicable if the following is true:
If you are running older firmware than 3.28.0000.00 (Apple users that purchased Promise Product from the Apple Store will have 3.29.0000.00 firmware with JBOD expander 1.07.0000.04). Specifically the problem was observed on firmware version 3.22.0000.00 or older
Save the Configuration log to check for link errors.
Using the CLI
This operation requires a TFTP server.
- Connect to the source RAID Head controller via Telnet or HyperTerminal.
- At the command line, type export -t subsystem -s 192.168.10.168 -f subsystem.txt and press Enter.
The -s specifies the TFTP server’s IP address or host name.
The -f specifies the name of the file to be exported.
Using WebPAM PRO
If you don’t have a TFTP server:
- Open WebPAM PRO in your browser.
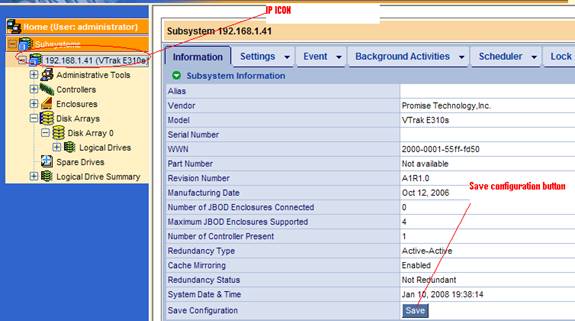
- Click the IP Icon on the left of the screen.
- Click the Save button at the bottom right of the screen.
See the figure below:
Step 3: Checking JBOD IO Modules for Link Errors
- Connect to each JBOD IO module via the RJ11 console.
- Verify that the JBOD IO module is running SEP firmware 1.07.0000.00 or newer.
At the command line, type enclosure and press Enter.
- Check for link errors on every JBOD IO module.
Each JBOD enclosure has two IO modules.
At the command line, type link and press Enter.
See the example below of a link counter output free of link errors
cli:> link Link Status: Port Type Rate Init Dev Link PRdy P 0 D01 SATA 3.0G OK End ---- Rdy P 1 D02 SATA 3.0G OK End ---- Rdy P 2 D03 SATA 3.0G OK End ---- Rdy P 3 D04 SATA 3.0G OK End ---- Rdy P 4 D05 SATA 3.0G OK End ---- Rdy P 5 D06 SATA 3.0G OK End ---- Rdy P 6 D07 SATA 3.0G OK End ---- Rdy P 7 D08 SATA 3.0G OK End ---- Rdy P 8 D09 SATA 3.0G OK End ---- Rdy P 9 D10 SATA 3.0G OK End ---- Rdy P10 D11 SATA 3.0G OK End ---- Rdy P11 D12 SATA 3.0G OK End ---- Rdy P12 D13 SATA 3.0G OK End ---- Rdy P13 D14 SATA 3.0G OK End ---- Rdy P14 D15 SATA 3.0G OK End ---- Rdy P15 D16 SATA 3.0G OK End ---- Rdy P16 CN1 SAS 3.0G OK Exp ---- Rdy P17 CN1 SAS 3.0G OK Exp ---- Rdy P18 CN1 SAS 3.0G OK Exp ---- Rdy P19 CN1 SAS 3.0G OK Exp ---- Rdy P20 CN2 SAS 3.0G OK Exp ---- Rdy P21 CN2 SAS 3.0G OK Exp ---- Rdy P22 CN2 SAS 3.0G OK Exp ---- Rdy P23 CN2 SAS 3.0G OK Exp ---- Rdy
Port:Port Id Type:SAS or SATA Rate:Rate 1.5G/3G Init:Init Passed Dev :Device Type Link:Link Connected PRdy:Phy Ready
Link Counter:
InDW
DsEr
DwLo
PhRe
CoVi
PhCh
P 0
----------
----------
----------
----------
----------
0x0B
P 1
----------
----------
----------
----------
----------
0x0B
P 2
----------
----------
----------
----------
----------
0x0B
P 3
----------
----------
----------
----------
----------
0x0B
P 4
----------
----------
----------
----------
----------
0x0B
P 5
----------
----------
----------
----------
----------
0x0B
P 6
----------
----------
----------
----------
----------
0x0B
P 7
----------
----------
----------
----------
----------
0x0B
P 8
----------
----------
----------
----------
----------
0x0B
P 9
----------
----------
----------
----------
----------
0x0B
P10
----------
----------
----------
----------
----------
0x0B
P11
----------
----------
----------
----------
----------
0x0B
P12
----------
----------
----------
----------
----------
0x0B
P13
----------
----------
----------
----------
----------
0x0B
P14
----------
----------
----------
----------
----------
0x0B
P15
----------
----------
----------
----------
----------
0x0B
P16
----------
----------
----------
----------
----------
0x01
P17
----------
----------
----------
----------
----------
0x01
P18
----------
----------
----------
----------
----------
0x01
P19
----------
----------
----------
----------
----------
0x01
P20
----------
----------
----------
----------
----------
0x01
P21
----------
----------
----------
----------
----------
0x01
P22
----------
----------
----------
----------
----------
0x01
P23
----------
----------
----------
----------
----------
0x01
Step 4: Interpreting Link Errors
Link errors may be observed on P0 through P15. This is not the main area of interest but you may want to take corrective action. The link counter may increment when the following change counts occur:
- (InDW) Invalid Dword Count
- (DsEr) Disparity Err Count
- (DwLo) Dword Sync Loss Count
- (PhRe) Phy Reset Problem Count
- (CoVi) Code Violations Count
- (PhCh) Phy Change Count
These errors can be isolated cases when a physical drive times out or resets, encounters read/write errors, or you have a bad AMMUX adapter.
- Clear the link error to see if the link counter increments its hexadecimal value.
At the command line, type link –a clear and press Enter.
- Then type link and press Enter.
This action might also require a rebuild of the disk array to which the physical drive belongs.
Focusing on Critical Links
The main area of interest is the link counters for P16 through P23. Errors here can affect the Transport operation or may cause the controller RAID Head IO modules to break a path and cause a controller to enter Maintenance Mode.
The links errors may increment when you issue the link command. These ports are connectors physically on the JBOD IO module that are labeled CN1 and CN2.
See page 23, Figure 17 for connector assignments and page 37 for additional information on the link command output in the VTrak J-Class Product Manual:
http://www.promise.com/upload/Support/Manual/VTrak_J610s_J310s_PM_v1.0a.pdf.If link errors are detected:
- Clear the link error.
At the command line, type link –a clear and press Enter.
- Check to see if the link error comes back.
At the command line, type link and press Enter.
- If errors return, identify the source of the link error.
- CN1 = P16 through P19
- CN2 = P20 through P23
Step 5: Correcting Link Errors
After you have identified the source of the link errors you must Fail Over the affected SAS domain before you can take corrective action.
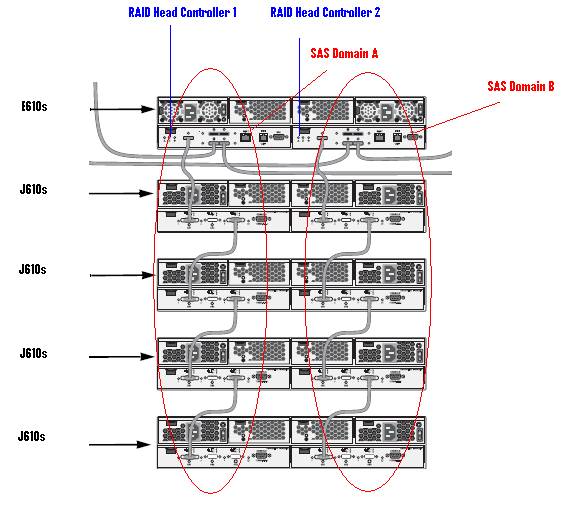
- Pull the RAID controller for the affected SAS domain from the enclosure
See diagram below:
When the RAID controller has been removed from the enclosure, all IOs will resume on the remaining RAID controller SAS domain. Controller Fail Over is almost instantaneous.
- Verify the controller Fail Over via the remaining RAID controller.
Using Telnet or HyperTerminal, at the command line, type ctrl and press Enter.
In the example below, note that controller 2 is no longer present:
administrator@cli> ctrl =================================================== CId Alias OpStatus Readiness Status =================================================== 1 OK Active 2 N/A Not Present N/A - Check the RAID controller CLI event logs to verify that there are no other problems.
At the command line, type event –l nvram and press Enter.
Then type event –l and press Enter.
- Find and correct the root cause of the link error.
A link error can be caused by:- Faulty SAS cable – Replace a suspect cable with a known-good cable.
- Debris blocking the SAS cable connector – Visually inspect and clean.
- Bad IO module CN1 or CN2 connector – Checked online after other possibilities are eliminated. At the command line, type sasdiag -a errorlog –l c2cport and press Enter. Look for incrementing errors.
- When you have corrected the root cause of the link errors on P16 through P23 on the respective IO modules verify all SAS cables are properly connected.
- Insert the RAID controller back into the enclosure and restore SAS connection connections to the Host.
When the RAID controller is replaced and all paths restored, the RAID Head will Fail Back and return to Active/Active mode. This action can take up to one minute from the moment all the SAS connections are restored and the RAID controller is inserted.To verify that the RAID Head is in Active/Active mode, do one of the following actions at the command line:
- Type ctrl –v and press Enter.
- Type event –l nvram and press Enter.
- Type event –l and press Enter.
- When the RAID Head is back to normal, repeat “Step 2: Checking the RAID Head for Link Errors ” to verify that the system is free of link errors.
- If link errors are reported, repeat the procedure beginning with “Step 3: Checking JBOD IO Modules for Link Errors ” on page 3 until you have eliminated all link errors on CN1 = P16 through P19 and CN2 - P20 through P23.
- If no link errors are reported, you have successfully completed the Link Error Workaround Procedure.
Additional Information:
1) Invalid Dword Count
The INVALID DWORD COUNT field indicates the number of invalid dwords that have been received outside of Phy reset sequences. An invalid dword is a dword that is not a data dword or a primitive.
2) Running Disparity Error Count
The RUNNING DISPARITY ERROR COUNT field indicates the number of dwords containing running disparity errors that have been received outside of Phy reset sequences. Running Disparity is a binary parameter with a negative or positive value indicating the cumulative encoded signal imbalance between the one and zero signal state of all characters since dword synchronization has been achieved.
3) Loss Dword Sync Count
The LOSS OF DWORD SYNCHRONIZATION COUNT field indicates the number of times the Phy has lost dword synchronization and restarted the link reset sequence of Phy reset sequences. Dword synchronization is detection of an incoming stream of dwords from a physical link by a phy.
4) Code Violation Error Count
Detection of a code violation does not necessarily indicate that the character in which the code violation was detected is in error. Code violations may result from a prior error that altered the Running Disparity of the bit stream but did not result in a detectable error at the character in which the error occurred.
These counters are used to monitor the quality of the link(phy). These counters are eventually per link(phy) base on the physical interface. The counter number we show for one particular port is the total number on all 4 link(phy) within that the port is located.
These counters represent the quality of the link, it reflects the signal quality on the link.
©2008 Promise Technology, Inc. All Rights Reserved.
No part of this document may be reproduced or transmitted in any form without the expressed, written permission of Promise Technology, Inc.

